Sampling with Replacement
Use the method of bootstrapping to 'create' more data in R.
“In statistics, bootstrapping is any test or metric that relies on random sampling with replacement.” I’m going to use this method of sampling to find means of a random variable.
First, we set the scenario. X is a random variable following a uniform distribution with the parameters a=1 and b=2 and 200 observations. We create a vector of size 1000 called xbars. Since we are dealing with random sampling I’ve set the seed to 5 so exact means and graphs can be recreated.
set.seed(5)
x = runif(200,1,2)
len <- length(x)
Max <- 1000
xbars <- c(1:1000)
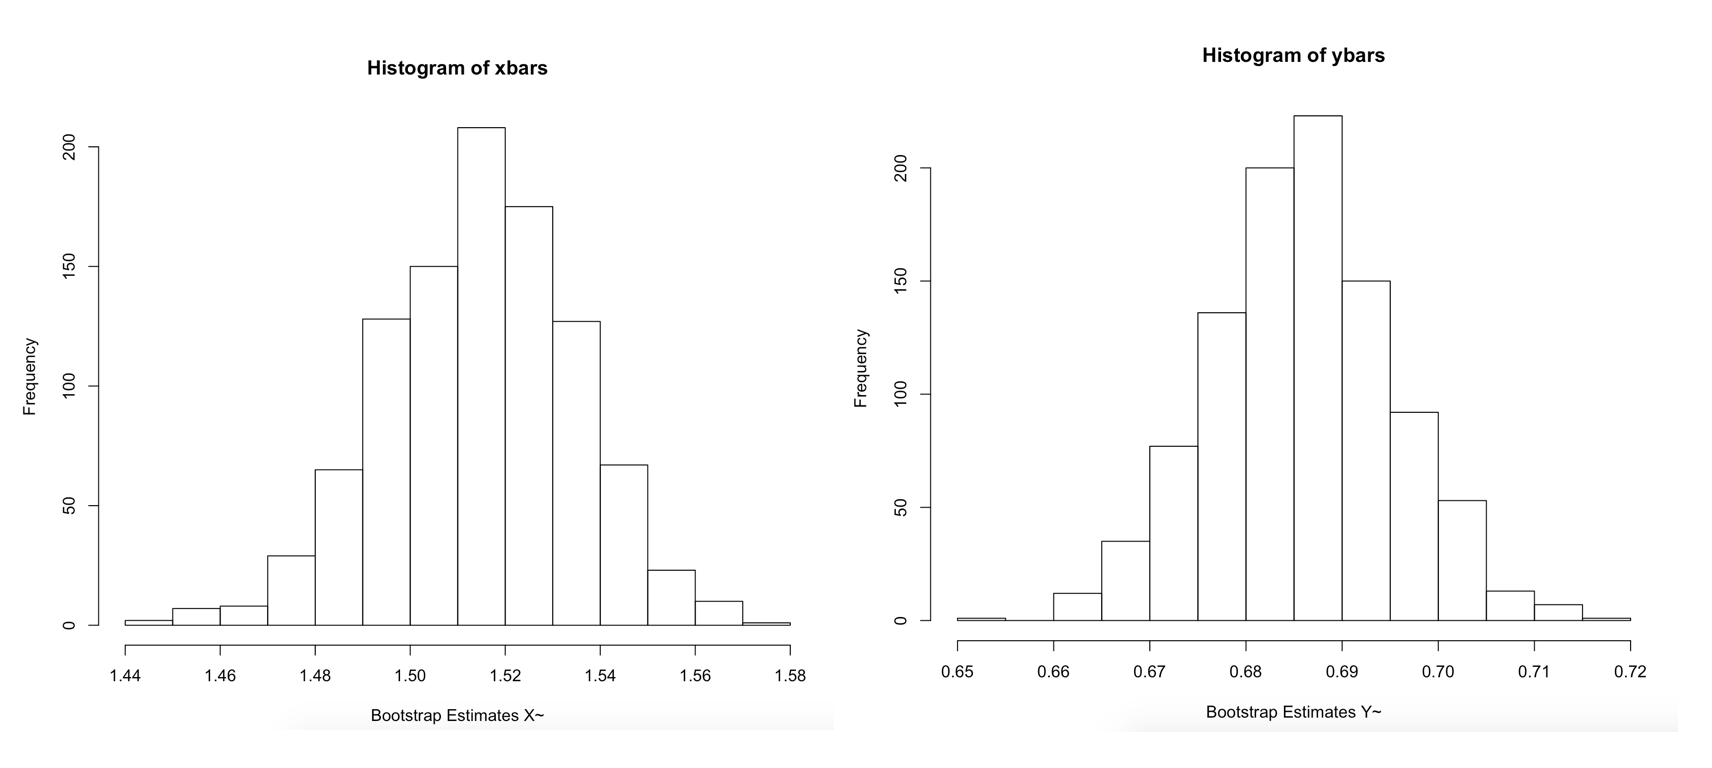
For each placeholder in xbars, the function takes a random sample of 200 with replacement from our random variable X and computes the mean. This process is resampling and the means in xbars are called bootstrap estimates.
for(i in 1:Max){
  xx1 <- sample(x, size=len, replace=TRUE)
  xbars[i] <- mean(xx1)
}
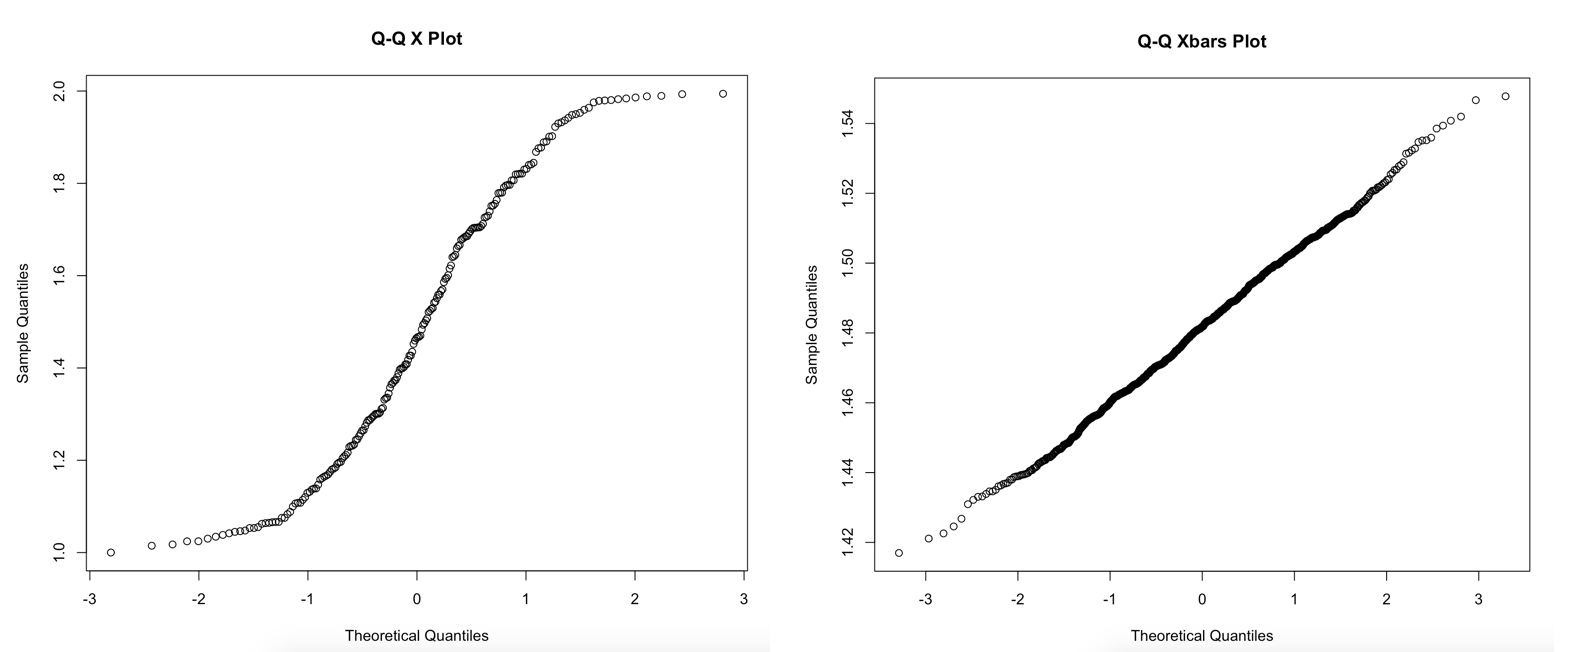
A Q-Q plot of our random variable X confirms it follows a uniform distribution. And a Q-Q plot of the sample means confirms normality.
The same process works with our random variable Y where Y=1/x and X follows our uniform distribution from above.
y = 1/x
len <- length(y)
Max <- 1000
ybars <- c(1:1000)
for(i in 1:Max){
  xx1 <- sample(y, size=len, replace=TRUE)
  ybars[i] <- mean(xx1)
}
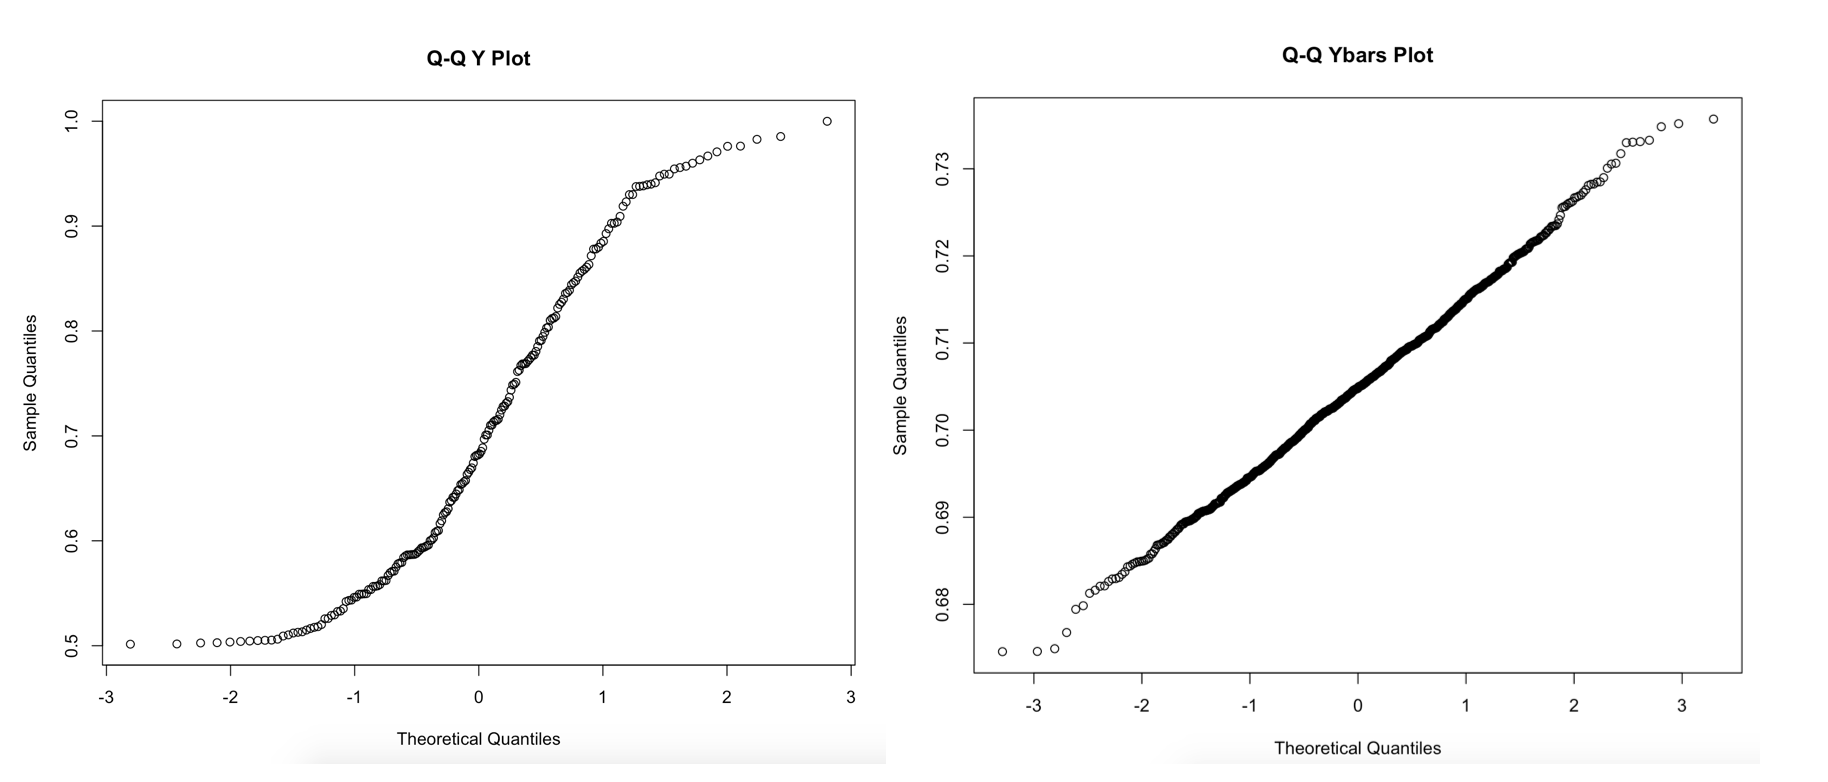
Again we can confirm the process is working as expected because there are no irregularities in the Q-Q plots.
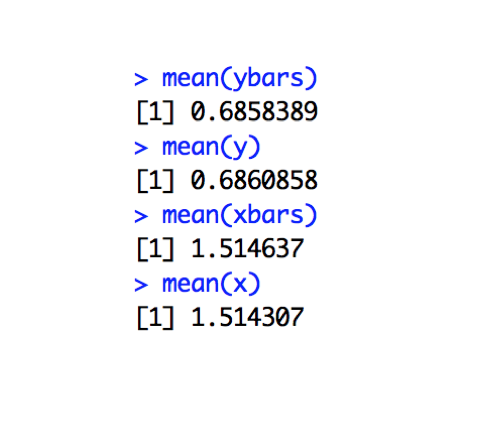
It is noteworthy to take a look at the means of our random variables and the means of the bootstrap estimators. We expect these numbers to be very close but not exactly the same because we are resampling many times with large n. When resampling, the most interesting information comes from the histogram of bootstrap means and analysis of the means’ distribution.
hist(xbars, xlab="Bootstrap Estimates X~")
hist(ybars, xlab="Bootstrap Estimates Y~")