Qualitative Data
Use principal components and factor analysis to approach qualitative data.
The data set we will be working with is an online resource from Professor James Sidanius at UCLA. It contains information from 400 students’ faculty evaluations. The data set includes 10 variables corresponding to the scores for each evaluation question, Sex of instructor (1 for male 2 for female), Salary in thousands of dollars, Years of teaching experieence, and Number of students in the class being evaluated. Also make a note that the data is clean and has no missing entries.
By the end of our analysis we’d like to be able to answer two questions:
- Do faculty with more experience receive better reviews?
- Do faculty with smaller class sizes receive better reviews?
Let’s take a look at the evaluation questions and try to summarize the information. Before we get into any calculations, it’s nice to notice every question is scored the same way aka a 1 is always the worse score and a 5 is always the best. This will make computaions less complicated.
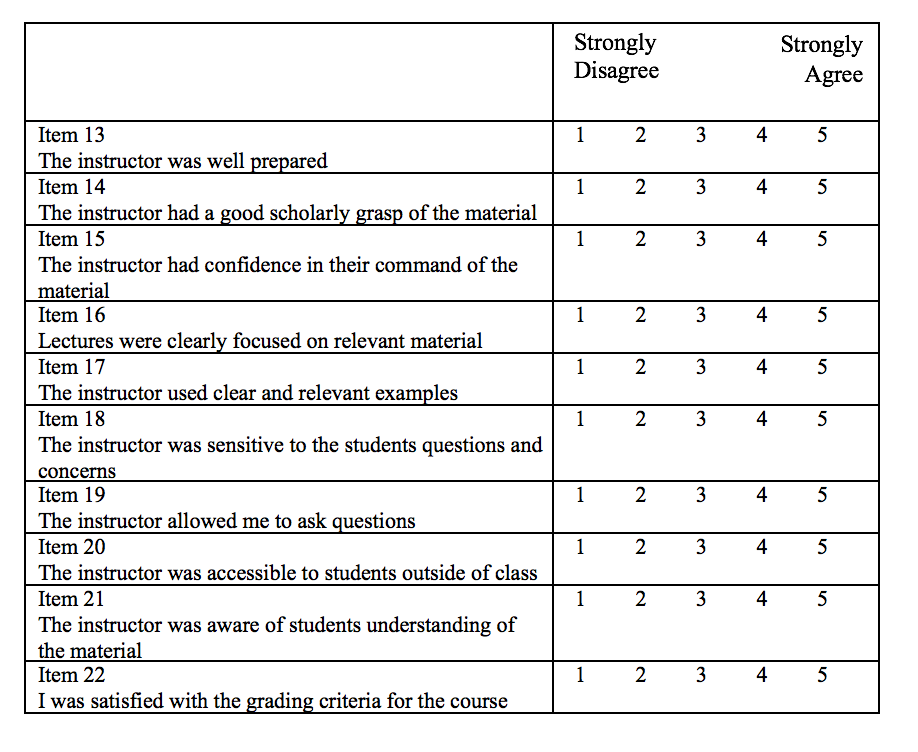
Our goal in summarizing is to capture the attitude students have towards their professor. The first step is to perform a principal component analysis so we can determine how many components are needed to fully summarize the 10 questions.
To perform principal component analysis in R, we will be using two packages: ‘psych’ and ‘GPArotation’. Be sure to install these packages if this is your first time using them.
attach(data)
library("psych")
library("GPArotation")
summary(princomp(~item13+item14+item15+item16+item17+item18+item19+item20+item21+item22, cor=TRUE))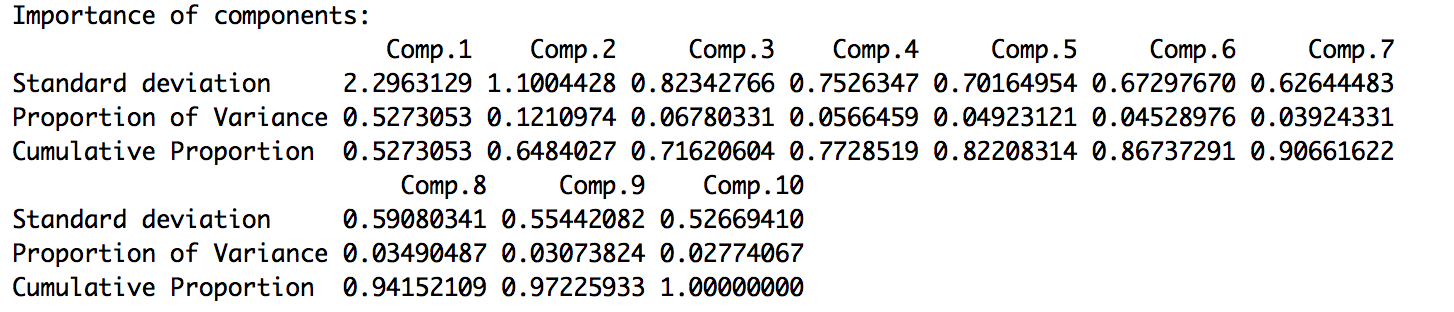
By convention, a component is said to still contain an important amount of information when the eigenvalue is greater than 1. Note: R gives ‘standard deviation’ which is the square root of the eigenvalue but gives the proportion and cumulative proportion on the eigen scale.
Squaring the standard deviations gives us the eigenvalues for each component: Comp.1= 5.27, Comp.2= 1.21, Comp.3= 0.67. Because component three has an eigenvalue less than 1, we will move forward using only 2 components to explain the data. The cumulative proportion values explain how much of the data is captured. Components one and two capture 64.8% of the information in the ten variables. Components one, two, and three capture 71.6% of the information in the ten variables.
The second step is to perform a varimax(orthogonal) rotation. Rotation redefines the factors in a way that gives more interpretable results. Orthogonal rotation is the most common type.
factorvariables <- data.frame(item13,item14,item15,item16,item17,item18,item19,item20,item21,item22)
prin <- principal(factorvariables,nfactors=2,rotate="varimax"scores=TRUE)
prin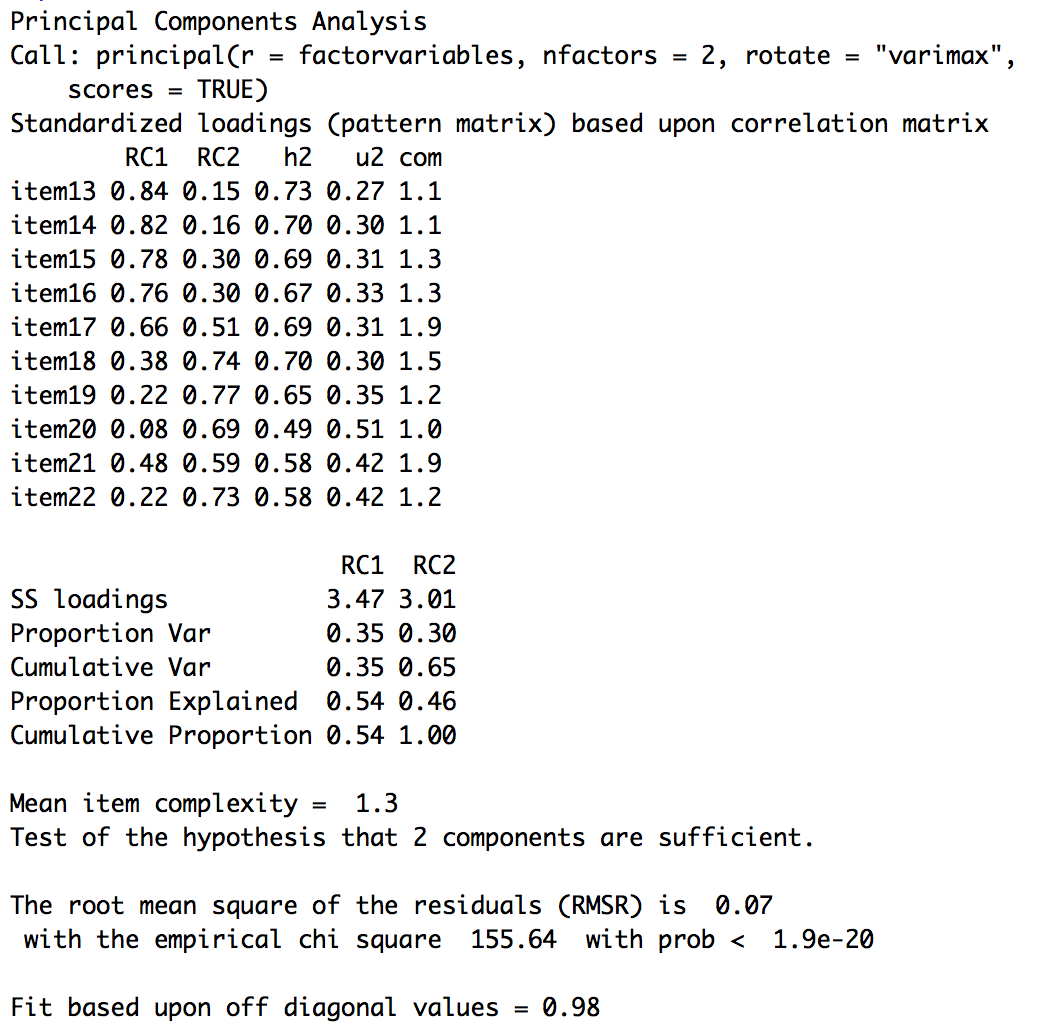
The important part of the output is the RC1 and RC2 columns. These numbers indicated which questions should be grouped together in the same component. When these numbers are greater than 0.5, an item is significant in the said group.
So, our first component will be composed of items 13,14,15,16,and 17. The second component will be composed of items 18,19,20,21,and 22. Let’s take another look at what questions these items refer to and identify a theme for the components.
It looks like Component 1 is describing quality of the instructor and Component 2 is describing technique of the instructor.
Now we’re ready to answer our goal questions: how do class size and experience effect performance ratings? We can do this by running correlation tests between the components’ scores and the variables we are interested in (yrsteach and nstudents).
data2 <- cbind(data,prin$scores)
cor(data2$RC1,data2$yrsteach)
cor(data2$RC2,data2$yrsteach)
cor(data2$RC1,data2$nstudents)
cor(data2$RC2,data2$nstudents)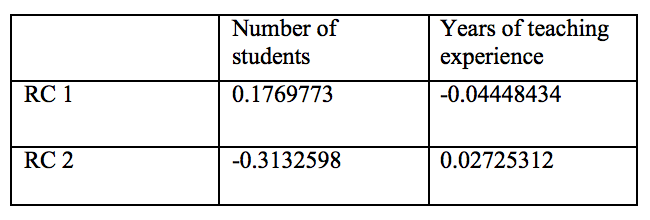
We see that an instructors’ years of experiance has no significant correlation with either component group. So, years of experience does not influence how students perceive their teaching. The correlation between number of students in a course and component group 2 is significant but weak. It indicated that as class sizes increase, instructors have lower ratings on questions relating to their technique. This is in line with expectations, in larger classes students tend to feel they are not able to ask question and that the professor is less accessible outside of class. As for component two and class size there is no significant correlation.
